Analysis Reports
After successfully processing a user-provided sample with a data processing pipeline, analysis reports are generated which represent the primary user-facing output of the pipeline. Analysis reports summarize processing results but also allow users to explore their results in depth.
To view analysis reports, browse to the solutions dashboard by clicking the “Solutions” button in the top left of the screen, and then selecting the “Reports” section. From the resulting list of available analysis reports, select one and click the button with the document icon in the column “Actions”.
The aitios® TOOC Report
The aitios® TOOC report is generated by both the aitios TOOC and aitios NIPT/PE solutions. It represents a report on sequencing data quality, and a summary of identified read origins. It also includes a viewer to browse sequencing reads mapping to the genome and contextualize them with additional information from the aitios® knowledge bases.
Open the example TOOC report from the “Reports” page after selecting the “aitiologic” demo workspace, as described above.
The example TOOC report at hand has been generated in the course of an aitios NIPT/PE pipeline run - the deconvolution step has thus been set to separate placental (fetal) from peripheral blood (maternal) sequencing reads.
Results Summary Section
This section contains metadata about the patient and sample to which this report belongs, and links out to these.
Read Statistics Section
This section contains plotted summary information about bulk and deconvolved sequencing reads derived from the sample. All reads are interactive and show more detailed information upon interaction by the user.

The top of the example TOOC report, showing the Results Summary section as well as plots for read summary statistics and CpG sites per read.
Summary Statistics Plot
This bar chart plot graphs the number of reads in the experiment, giving an overall estimation on the yield of the experiment. The following values are displayed:
Total: The total number of sequencing reads emitted by the sequencing device.
Valid (Total): The number of sequencing reads passing filtering.
Valid (CpG): The number of valid reads which have CpG sites (needed for origin classification).
Valid (Mapped): The number of valid reads which could be mapped to the genome.
Invalid (Total): The total number of sequencing reads failing filtering.
Invalid (Quality): The number of invalid reads which are invalid due to poor sequencing quality.
Invalid (Short): The number of invalid reads which are invalid due to being too short.
Invalid (Blacklisted): The number of invalid reads which map to blacklisted regions of the genome.
CpG Sites per Read Plot
This line chart plots the percentage of reads which have at least the given number of CpG sites, giving an estimation on the power of origin classification from epigenomic analysis.
Origin Score Distribution Plot
This chart plots the distribution of origin classification scores across all validly mapped and classified reads, as well as the threshold value for classification.
Reads with a classification score less than the cut-off value are categorized as belonging to the background (peripheral blood), while reads above the cut-off are categorized as being derived from the placenta.
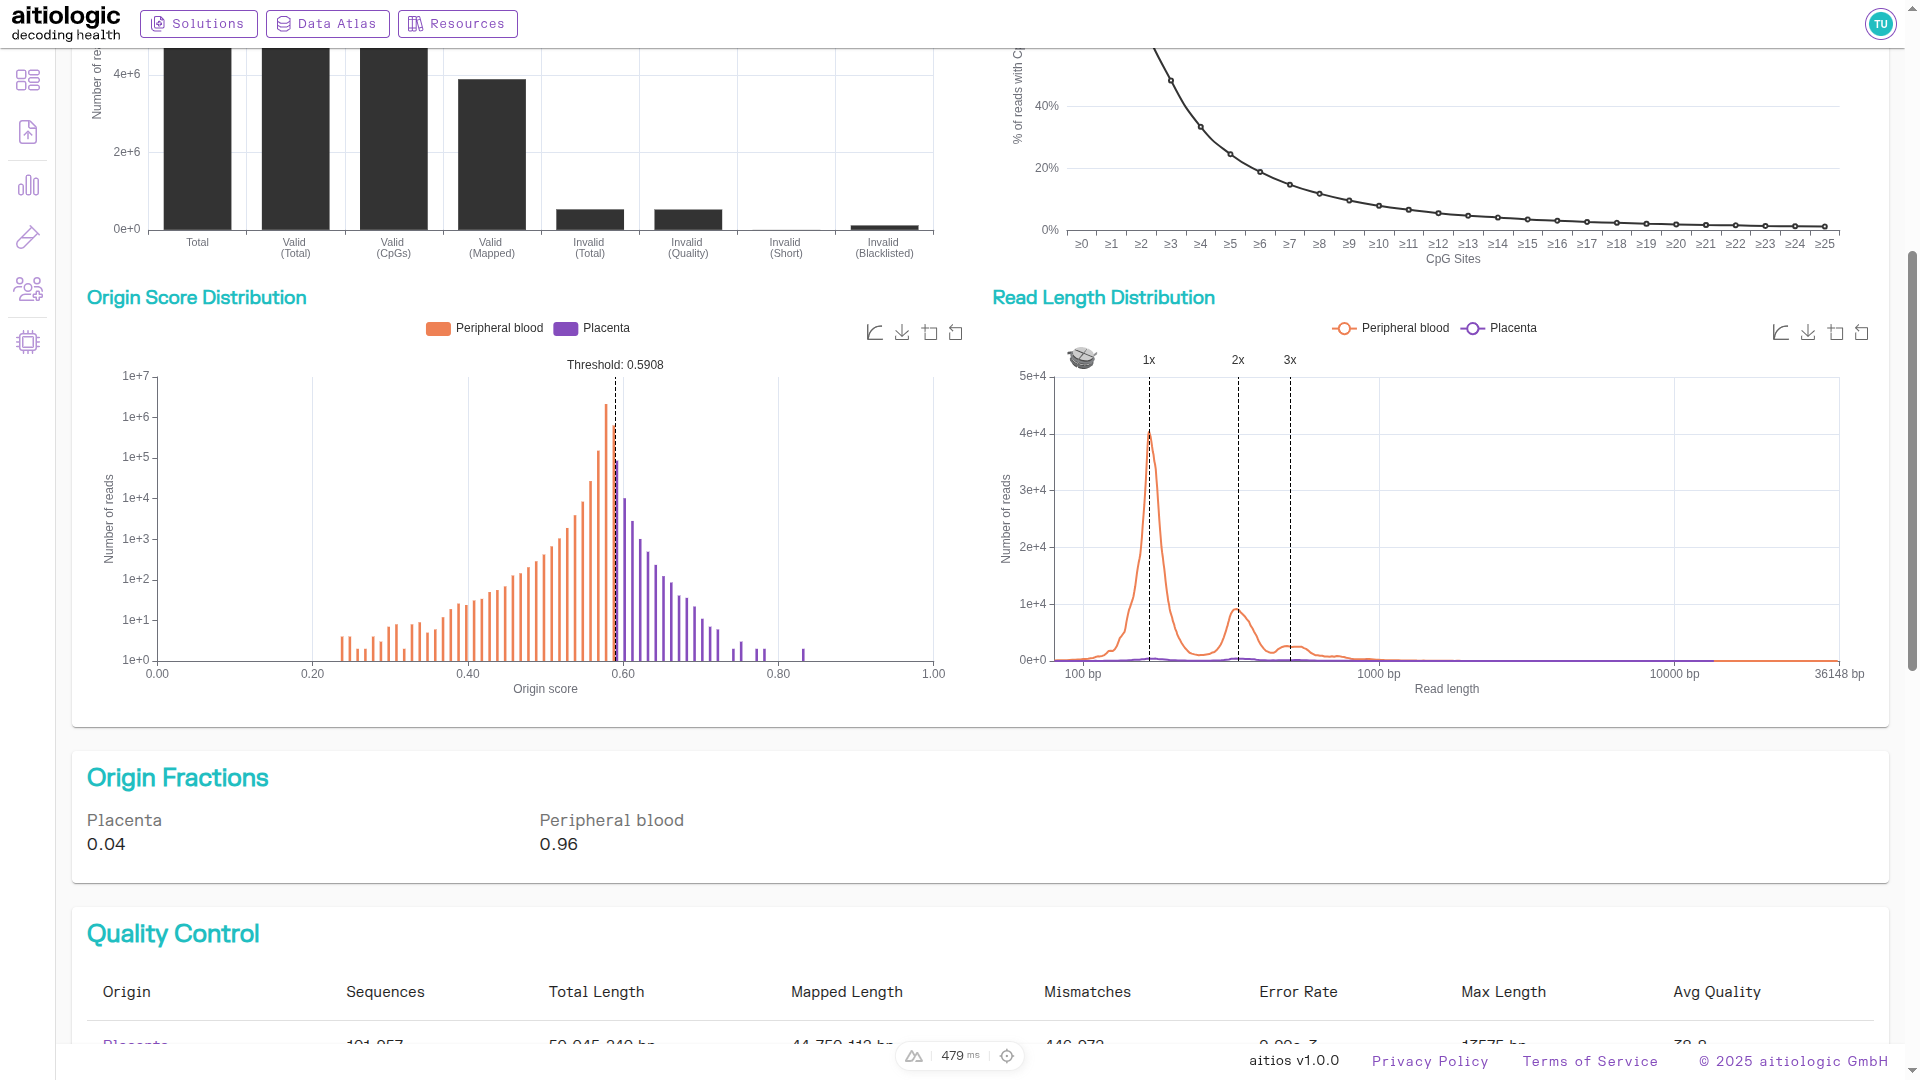
The middle section of the example TOOC report, showing origin score distribution plot and the read length distribution plot, as well as the tabular summary of deconvolved read statistics.
Read Length Distribution Plot
this chart plots the distribution of read lengths after origin classification of reads, and highlights the expected location of peaks due to mono-, di- and trinucleosome structures.
Hint
Drag over the Origin Score Distribution or Read Length Distribution plots to zoom into a data range of interest.
Quality Control Section
This section shows several key metrics of sequencing data quality after origin classification in a tabular format.
Read Alignments Section
This section allows the user to browse all aligned reads from the experiment in a genomic viewer. Deconvolved reads are split according to their calculated origin (in this case, peripheral blood and placenta). By pressing the menu button next to the section title, users may add additional tracks containing contextual information:
Gene of interest selection
aitios® Methylation Profiles: Tissue and cell-type specific methylation profiles for visible CpG sites
RefSeq RefGene: Gene identities of visible region including intron and exon status
CpG Annotation: Categorization of visible CpG sites into island regions
ClinVar Annotation: Presence and type of known clinically relevant variants in the visible region
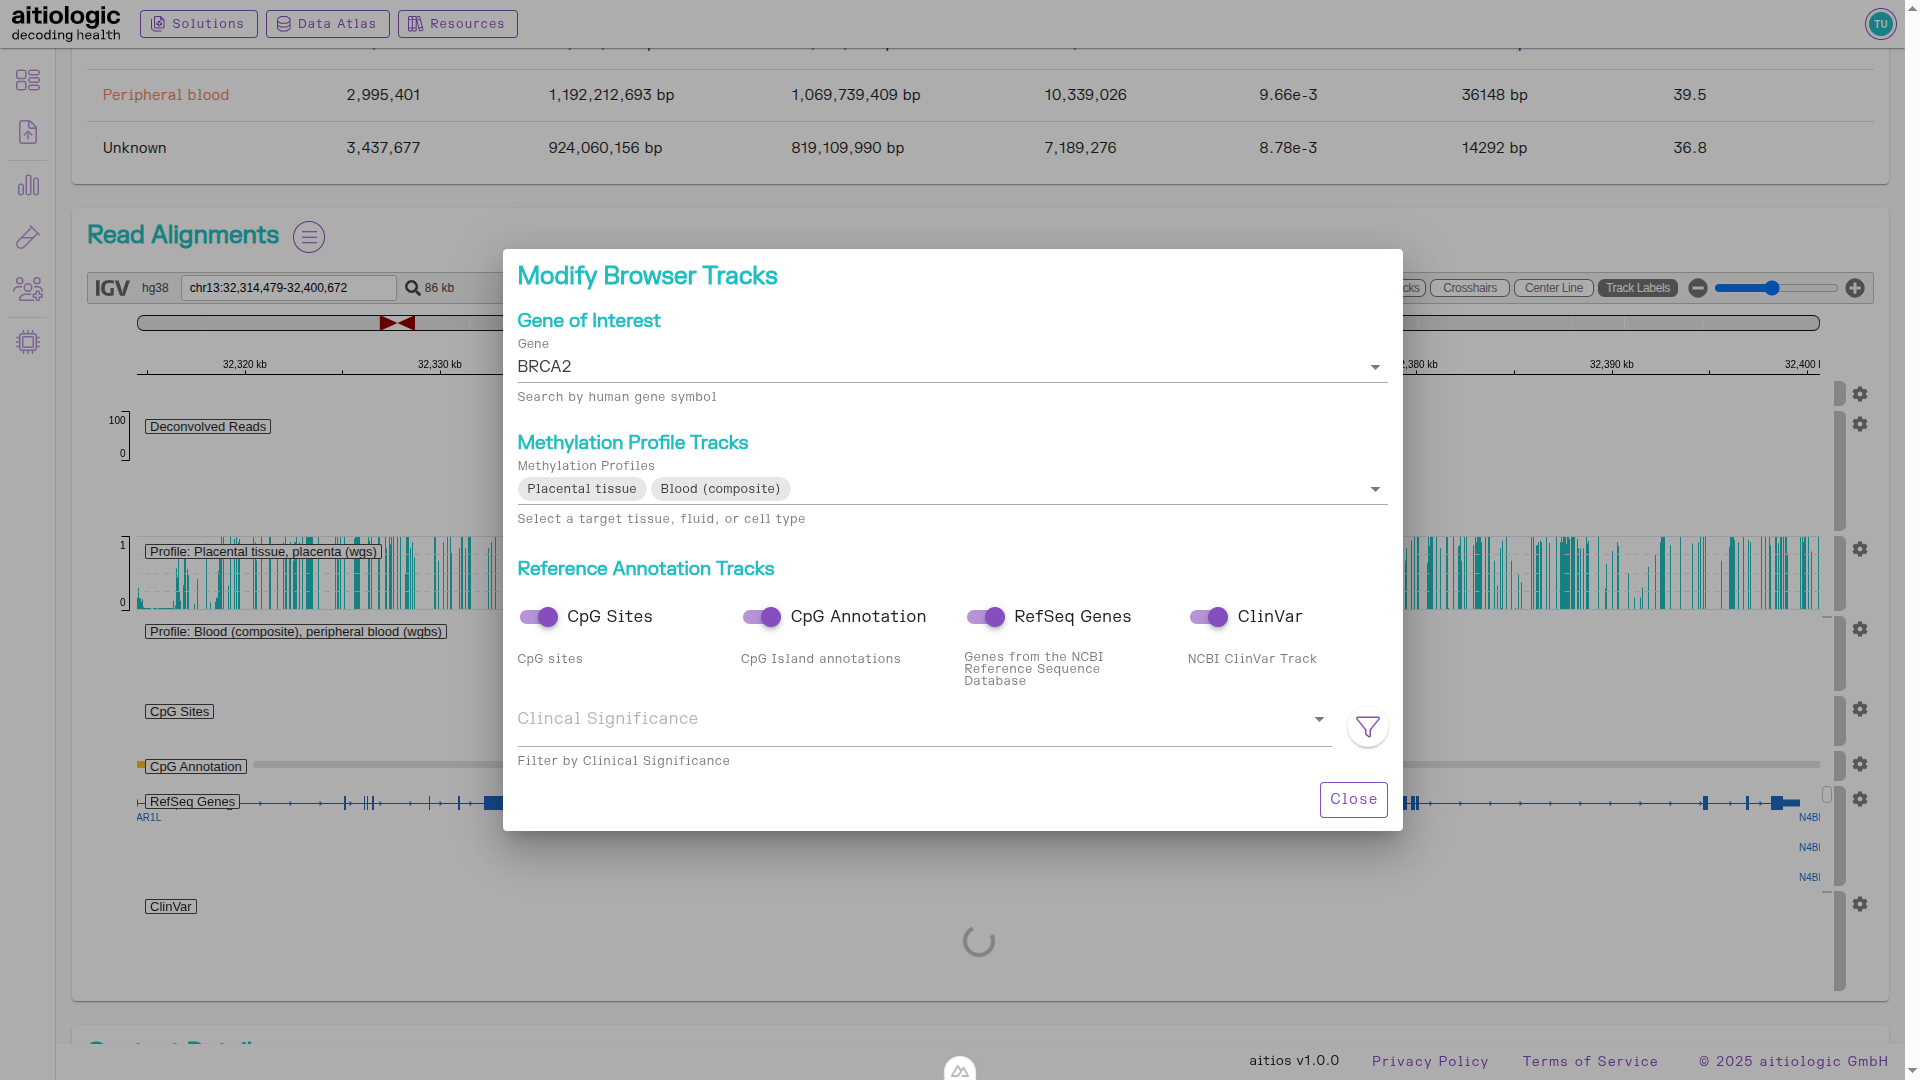
The bottom section of the example TOOC report, showing the options for supplementing the read alignment viewer with further information.
Read alignments displayed in the viewer can be downloaded by clicking on the button with the camera icon.
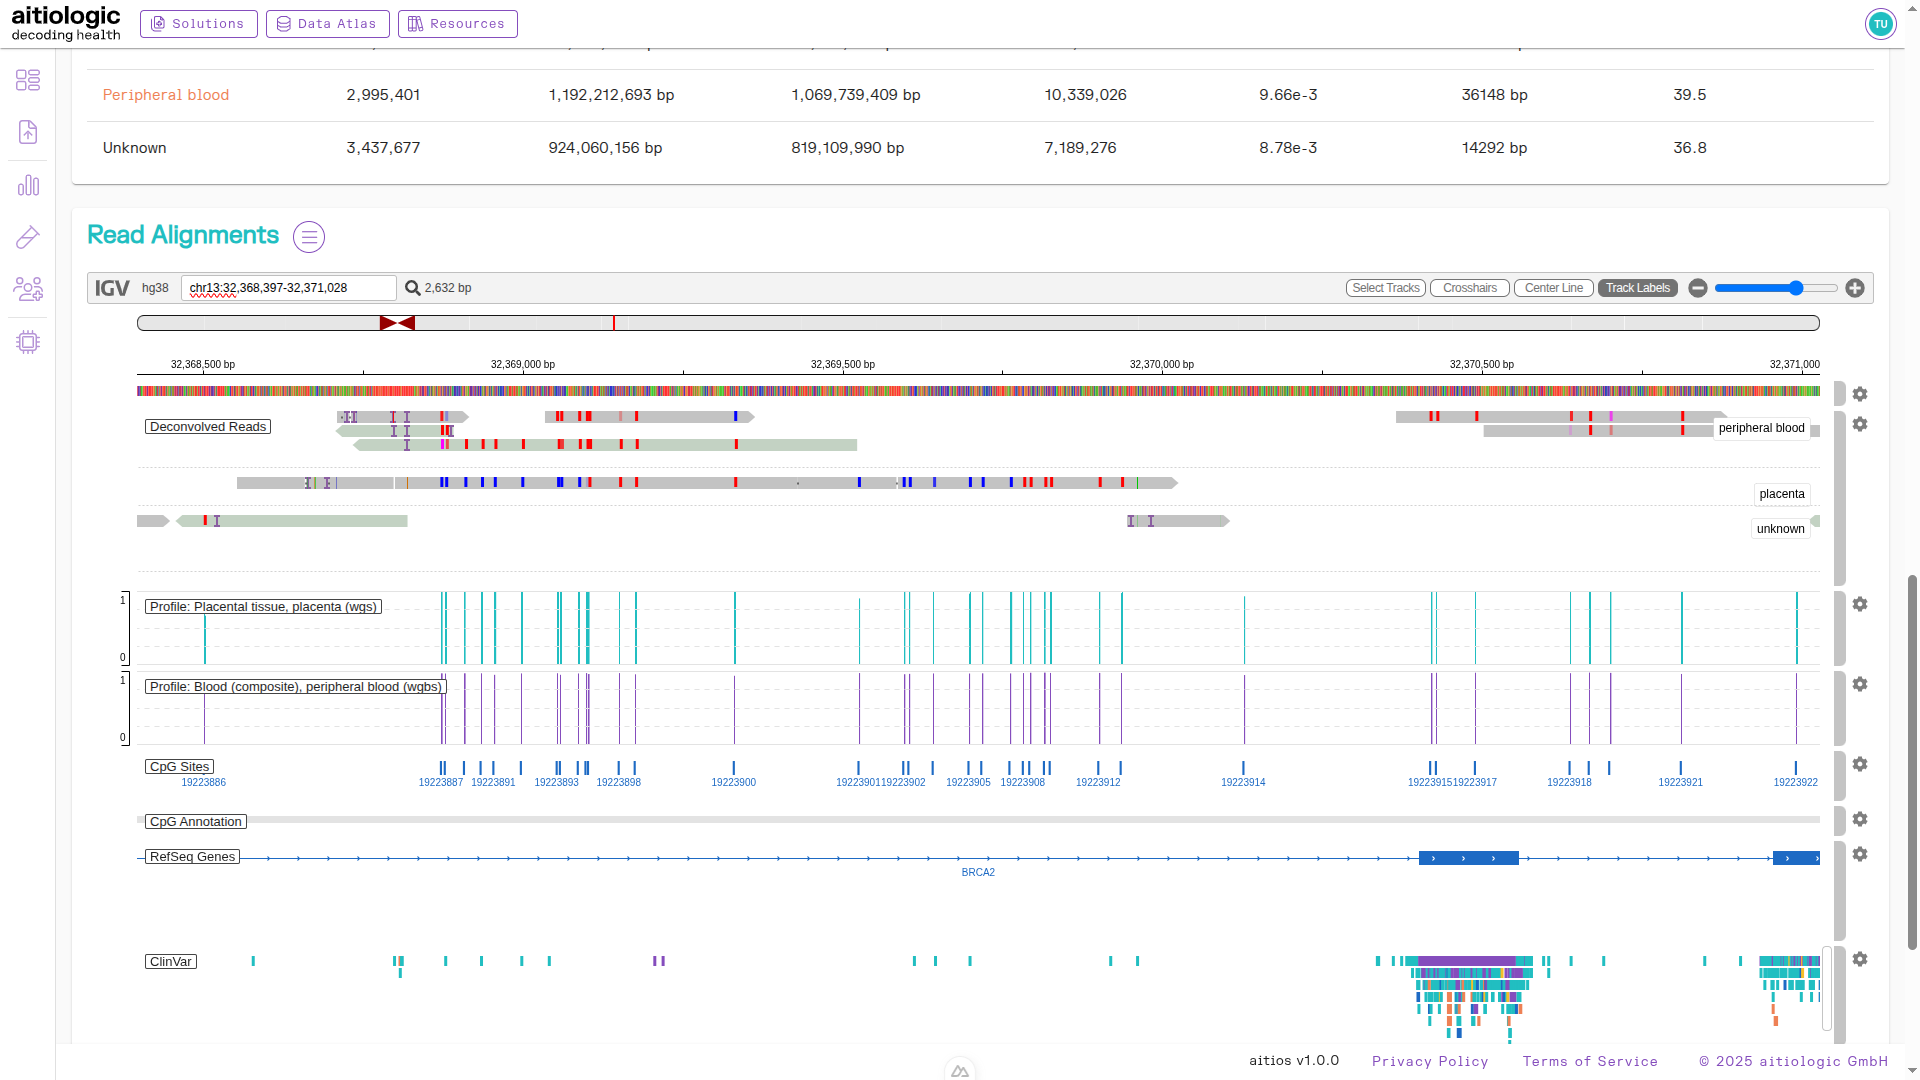
An example snapshot of the read alignment viewer, showing deconvolved reads and supplemental information.
Secondary Data Download
To download raw deconvolved reads and/or the underlying data structure used for constructing the TOOC report, click the button with the diskette icon next to the title of the page and select a file to download.
Hint
Page navigation is disabled until all active downloads either complete or are canceled.
The aitios® NIPT/PE Report
The aitios® NIPT/PE report is generated exclusively by the aitios NIPT/PE solution and builds on top of the sequencing read deconvolution provided by the aitios TOOC solution. It summarizes the fetal sex, pre-eclampsia risk, as well as any fetal chromosomal or subchromosomal aberrations identified from the provided sample. Small genetic variants such as single nucleotide variants (SNVs) identified in maternal and/or fetal fraction are displayed and annotated with functional, clinical and population genomic information to aid interpretation.
Open the example NIPT/PE report from the “Reports” page after selecting the “aitiologic” demo workspace, as described above.
Results Summary Section
Similarly to the TOOC report, this section contains metadata about the patient and sample to which this report belongs, and links out to these.
PE and Chromosomal Aberrations Section
This section gives a summary overview over assessed pre-eclampsia (PE) and chromosomal aneuploidy risks, as well as the identified fetal sex and fetal fraction.
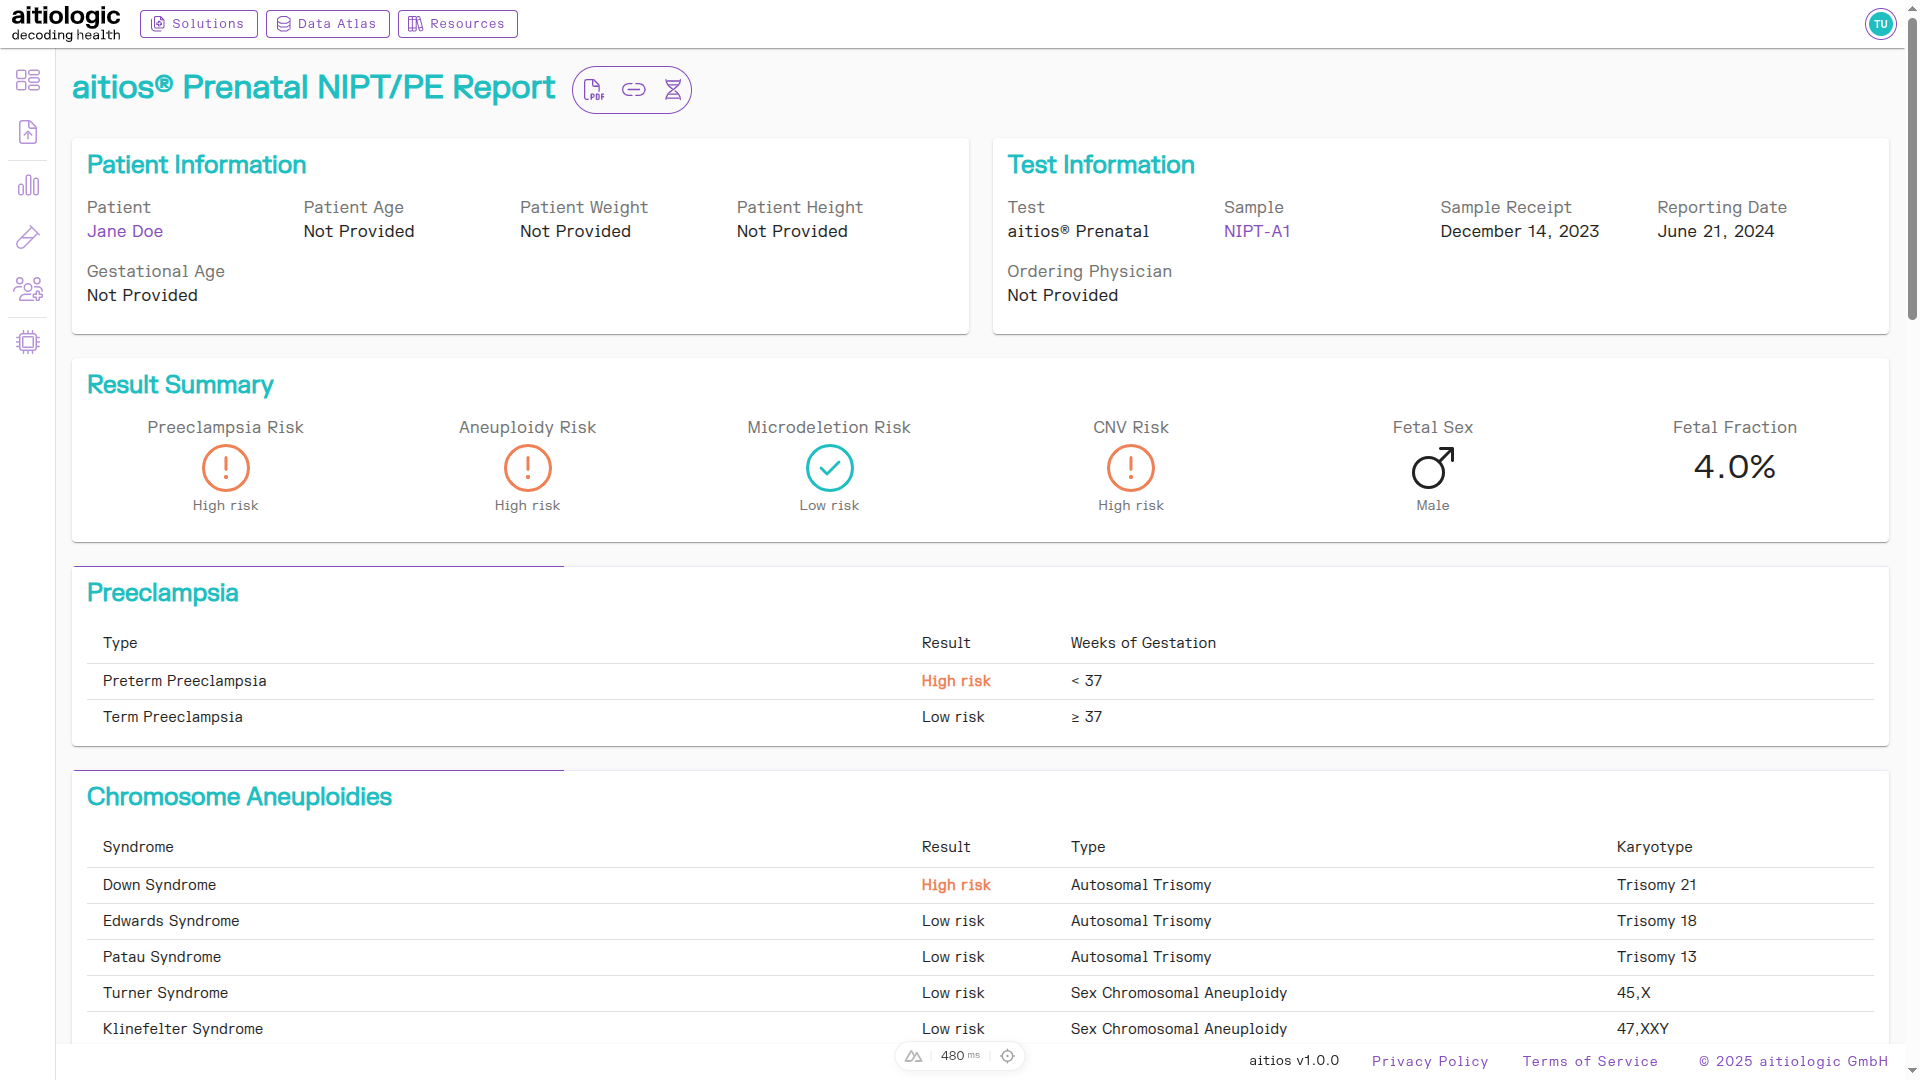
The top of the example NIPT/PE report, showing the Results Summary section, the PE risk as well as a chromosomal aberration risks found.
Microdeletions Section
This section gives a summary overview over the risk of common microdeletions.
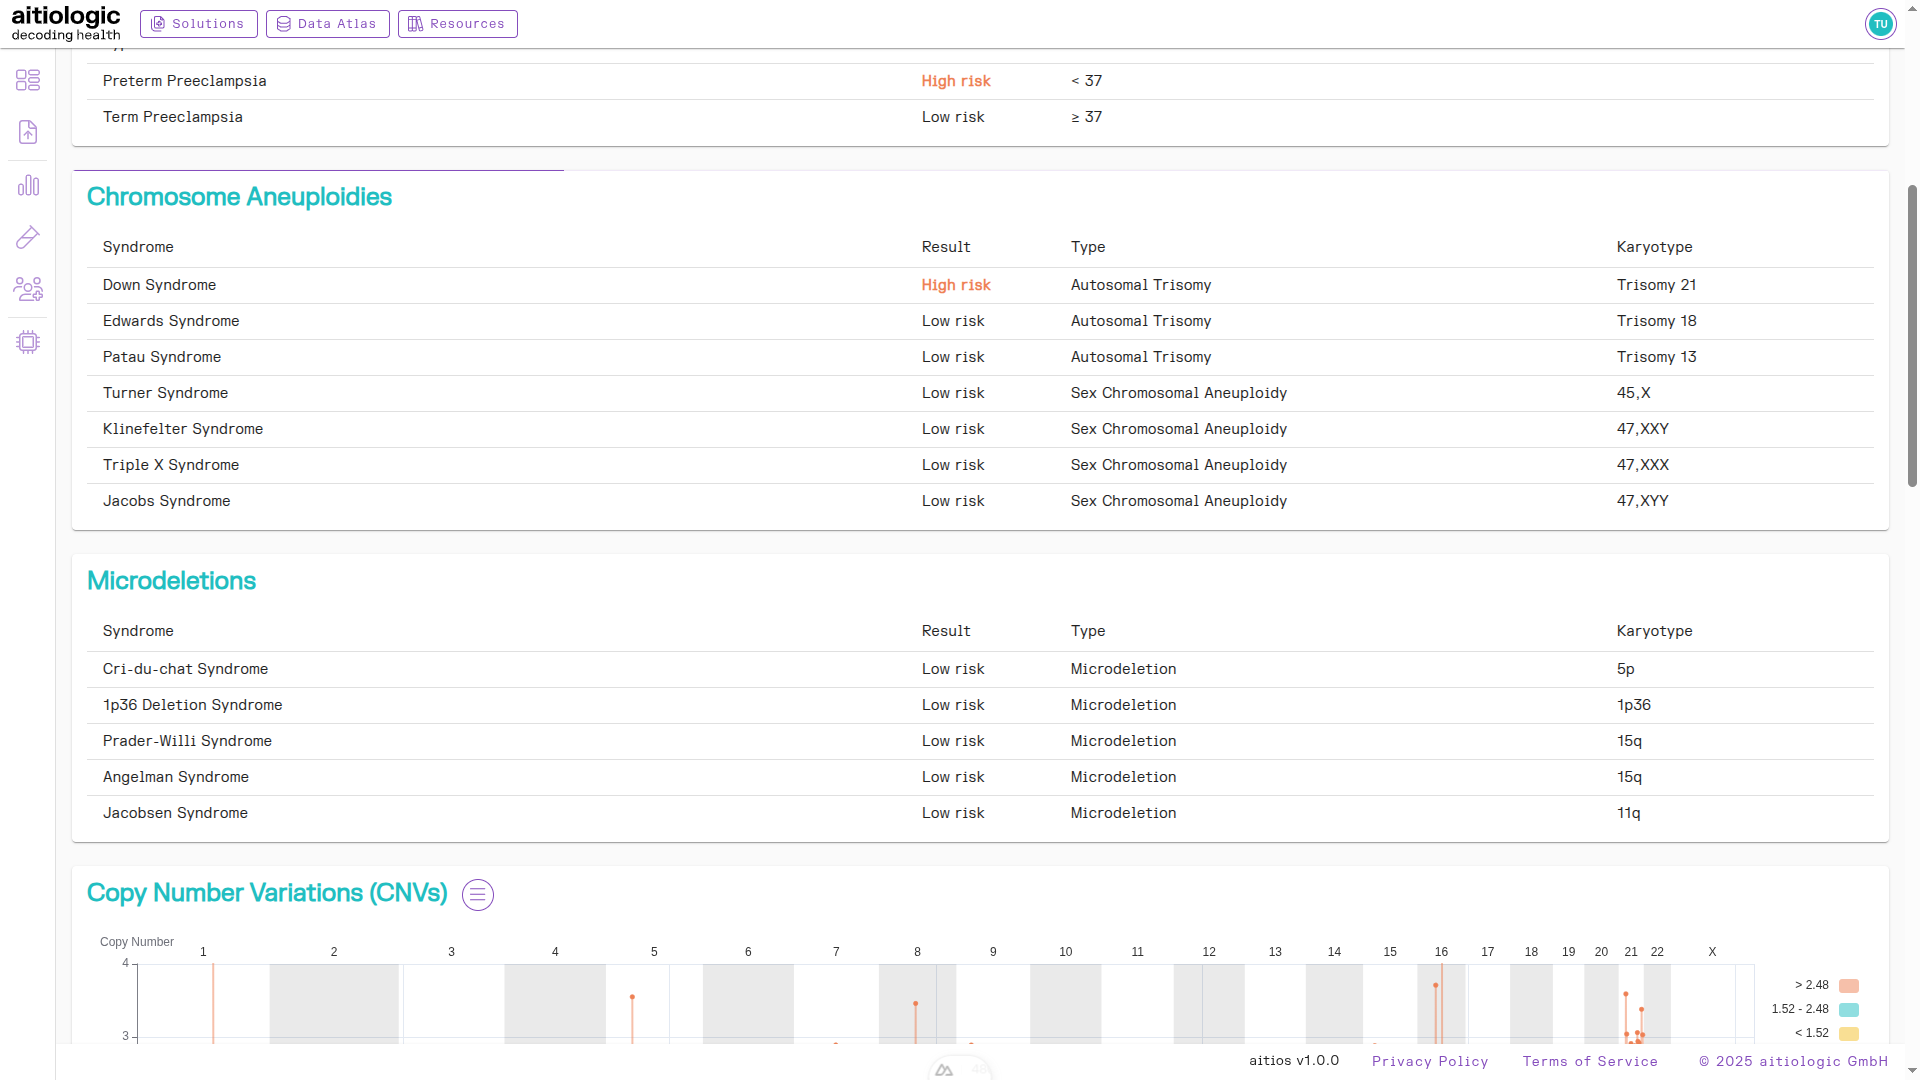
Summary of microdeletion risks found.
Subchromosomal Aberrations Section
This section contains a chart and tabular view of the risk of aberrations below chromosomal resolution.
Tip
By default, the resolution of this section is set to 500 kilobases, but can be changed in the three bars menu next to the section heading.
Segments with significantly high or low Z-score are displayed in red and yellow colors respectively, and contained in the table.
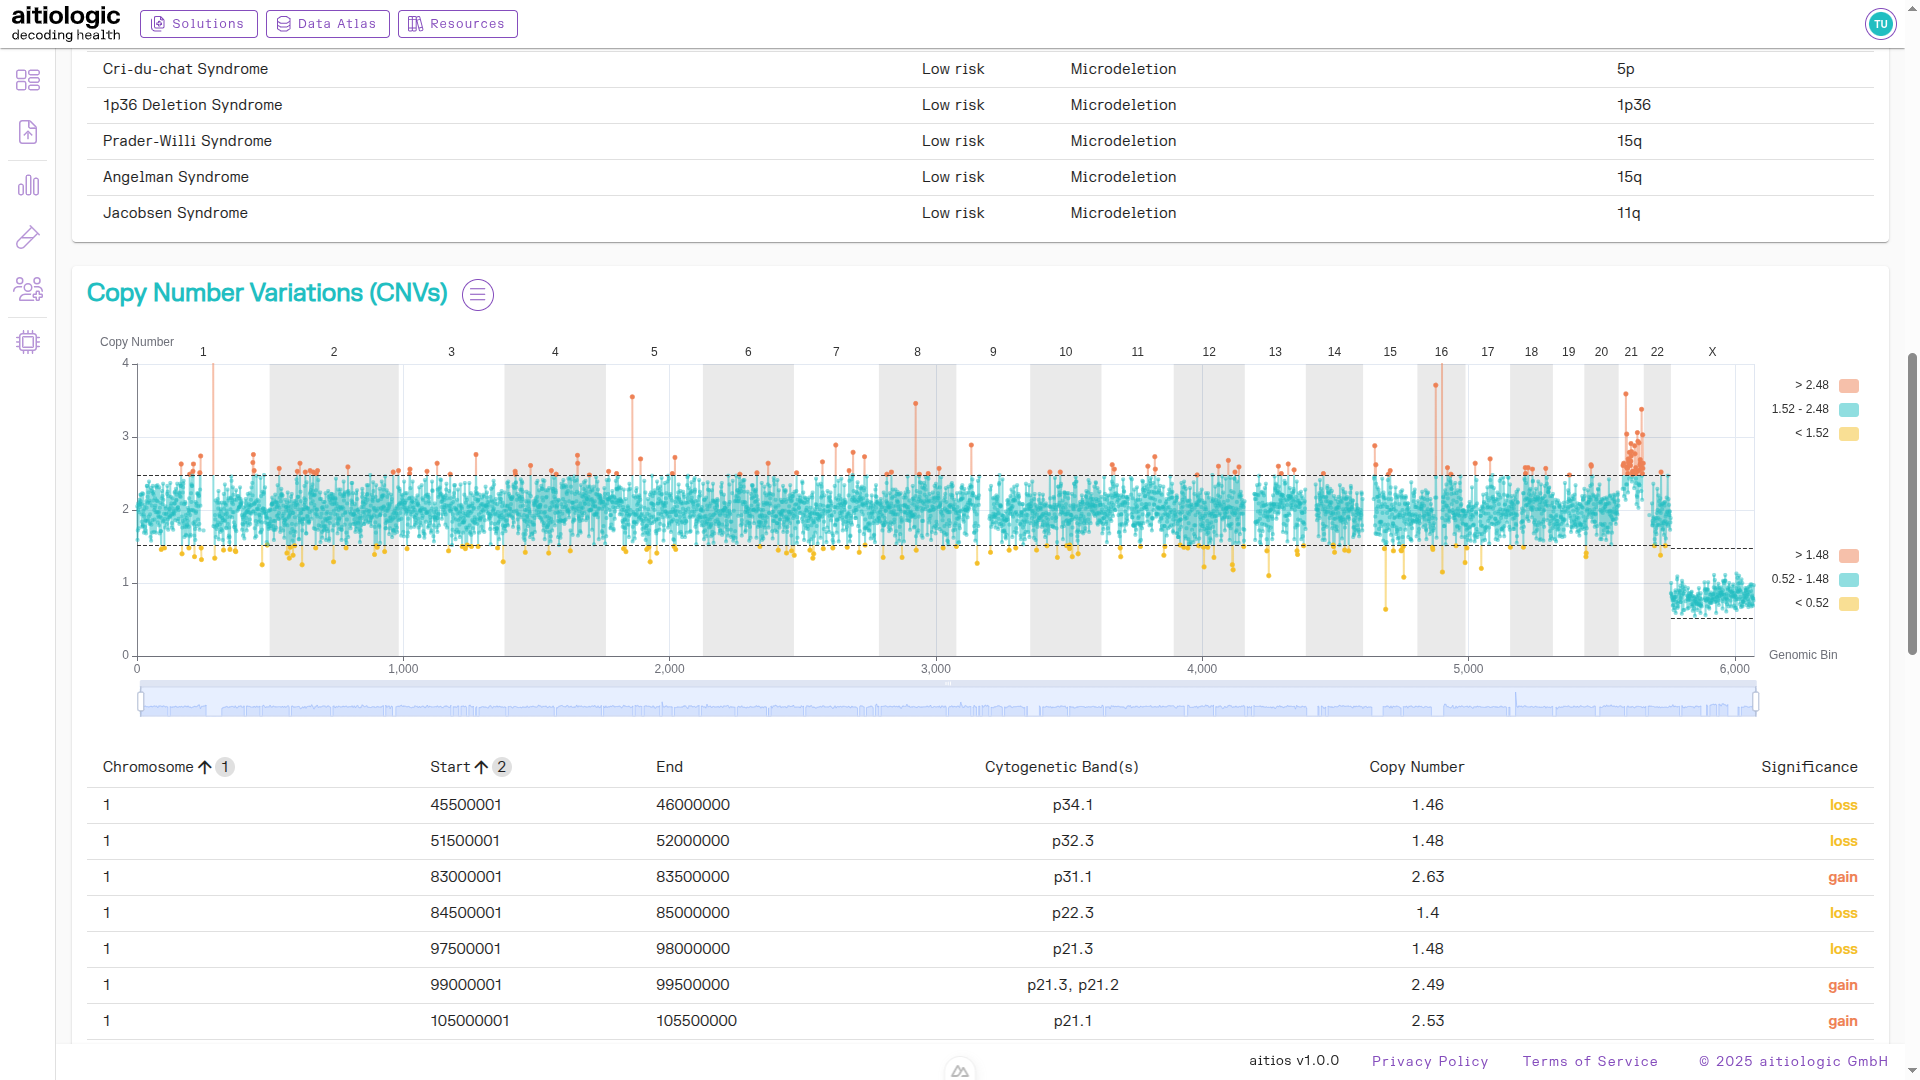
The top of the example NIPT/PE report, showing subchromosomal aberrations.
Genetic Variants Section
This section contains tabular information about single-nucleotide variants (SNVs) and small indels found in both the maternal and placental fraction. Variants are annotated with functional, population-genomic and clinical data from automatic tools and public databases to aid interpretation:
functional annotation and estimation of functional impact via SnpEff
population-wide allele frequencies from gnomAD
clinical severity from NCBI ClinVar
Retrieved variants can be filtered and sorted using origin fraction (maternal or placental), data quality metrics and the above annotations. The default filtering limits displayed variants to be clinically significant (e.g., assigned “Pathogenic” or “Likely Pathogenic”) and/or highly impactful (e.g., nonsense mutations) while maintaining a population-wide allele frequency of below 5%. Also, by default only variants are are selected for which the placental fraction contained at least one non-reference allele.
To change the default filters, click the filter symbol next to the section heading.
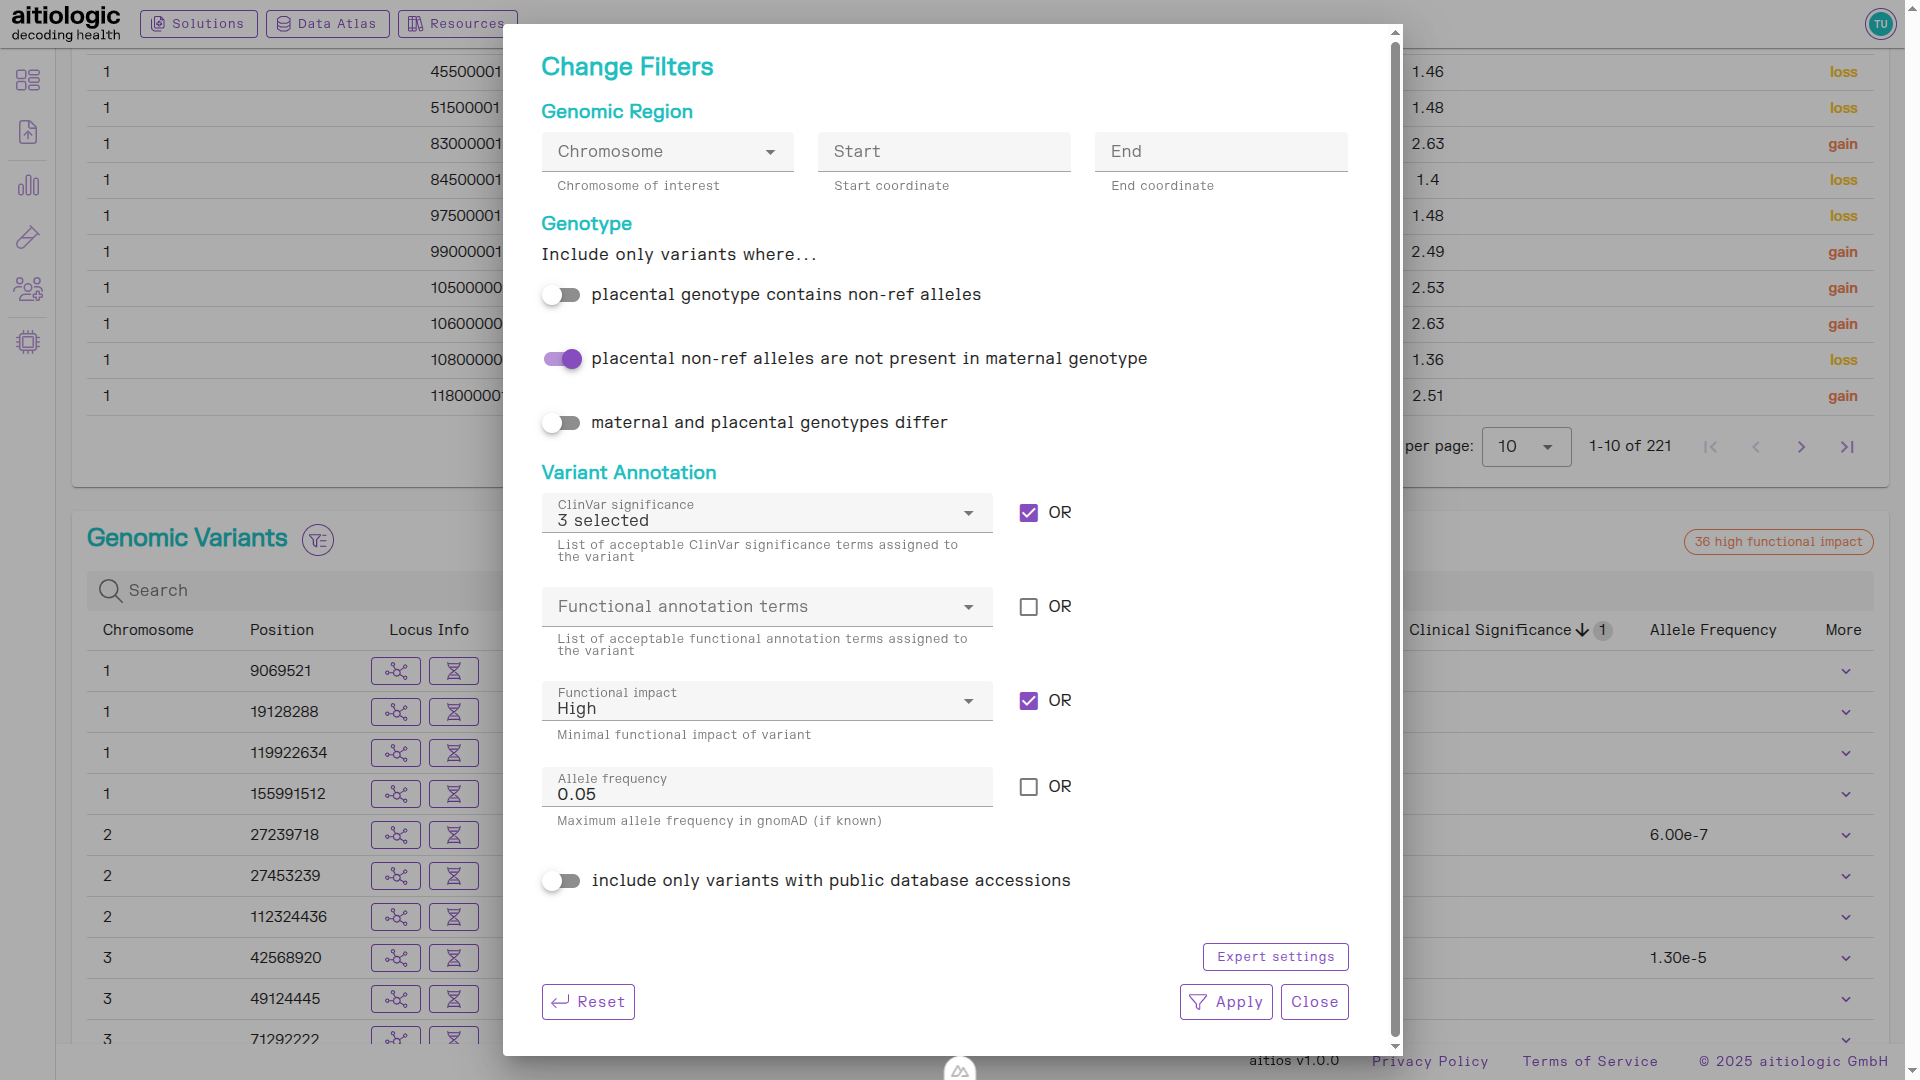
The genetic variants section of the example NIPT/PE report, showing options for changing filtering of displayed genetic variants information.
In the example report at hand, we remove the requirement for variants being present in the placental function to reveal a pathogenic variant in the maternal data fraction.
After clicking “Apply”, the list of variants is recomputed.
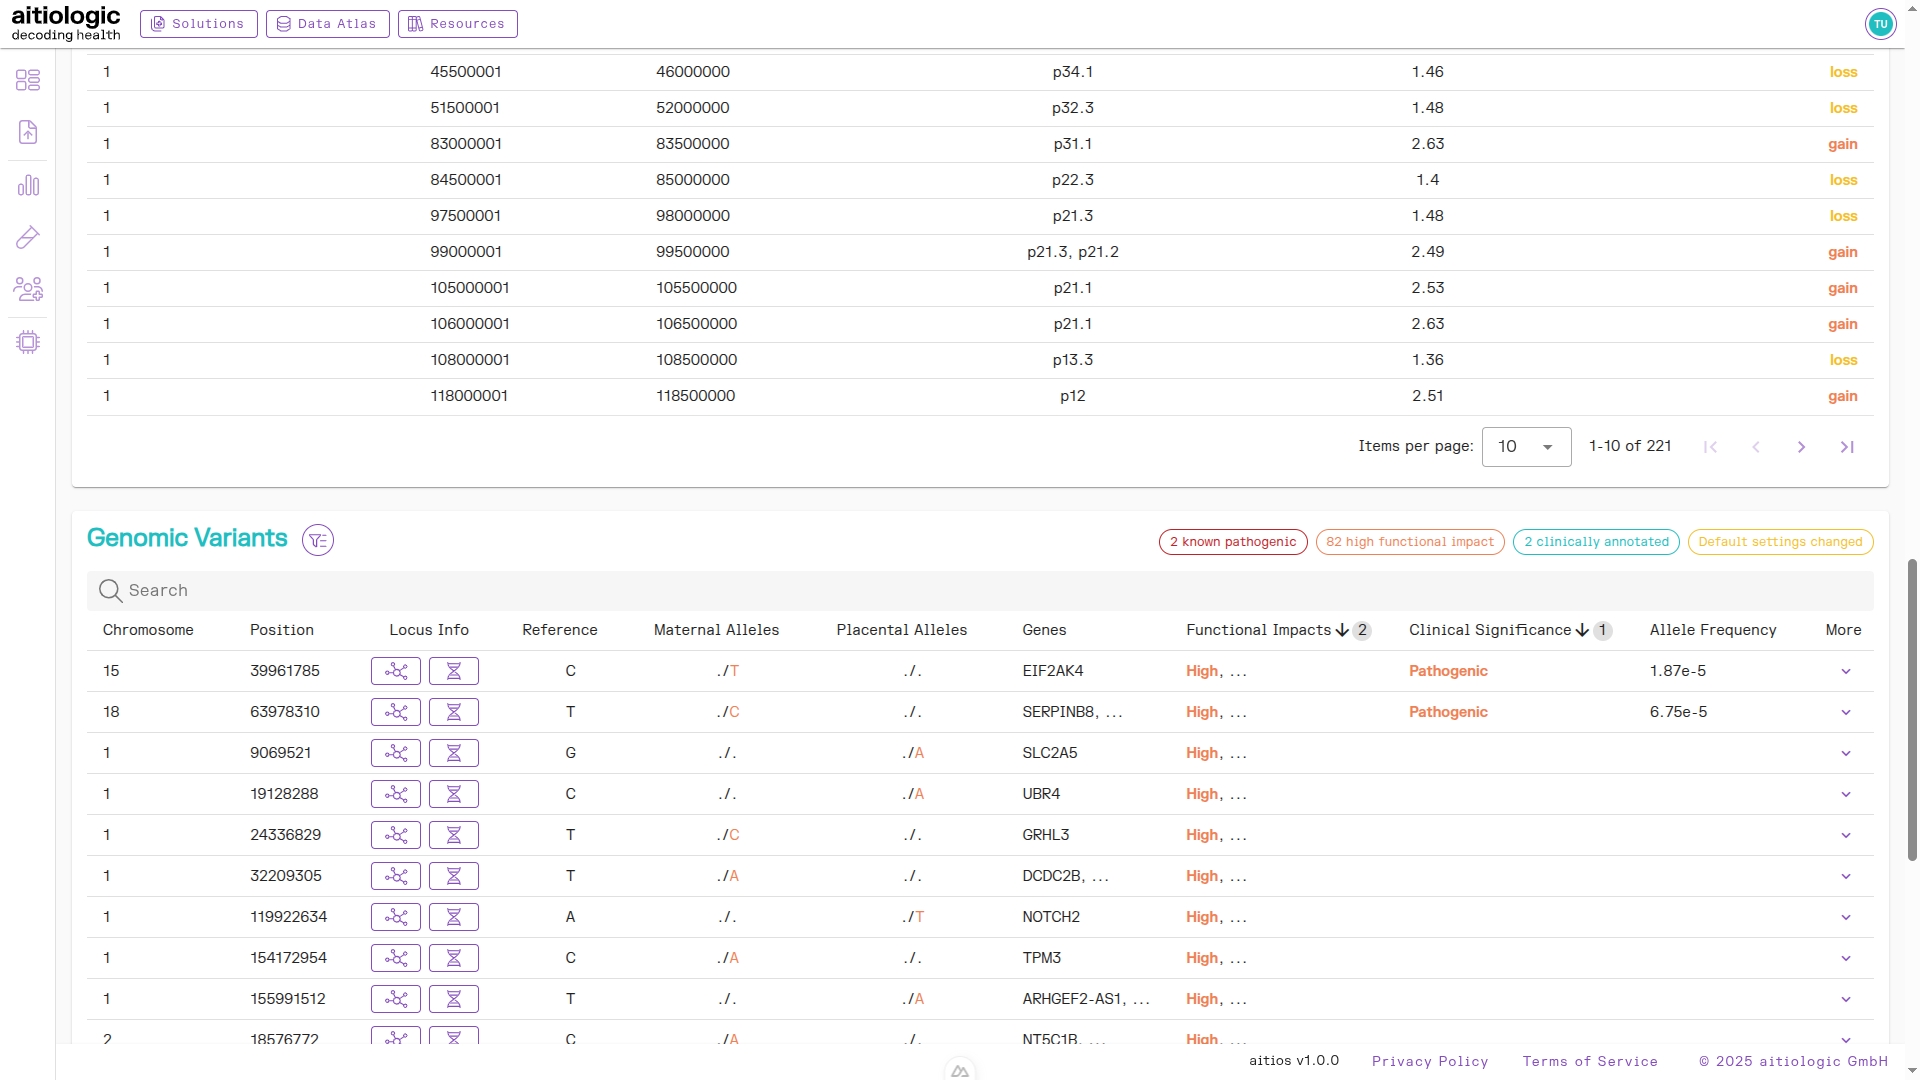
The bottom section of the example NIPT/PE report containing genetic variants information and read QC metrics.
To retrieve additional information on a variant of interest, click the “Arrow down” symbol under the “More” column. This shows clinical database accessions and detailed clinical, population-genomic and functional annotations for the variant at hand (if such data exists). In the example report at hand, we find database links to several clinical databases and allele frequencies in ExAC and gnomAD.

The genetic variants section with additional functional, population-genomic and clinical information displayed for a high-impact variant.
For variants without any pre-existing annotation, the (automated) functional annotation can be used in combination with investigation of the genomic environment of the variant to improve interpretation. By hitting the DNA symbol button under the “Locus Info” column, database information on the gene in which the variant is located (if any) are displayed, including known diseases related to it.
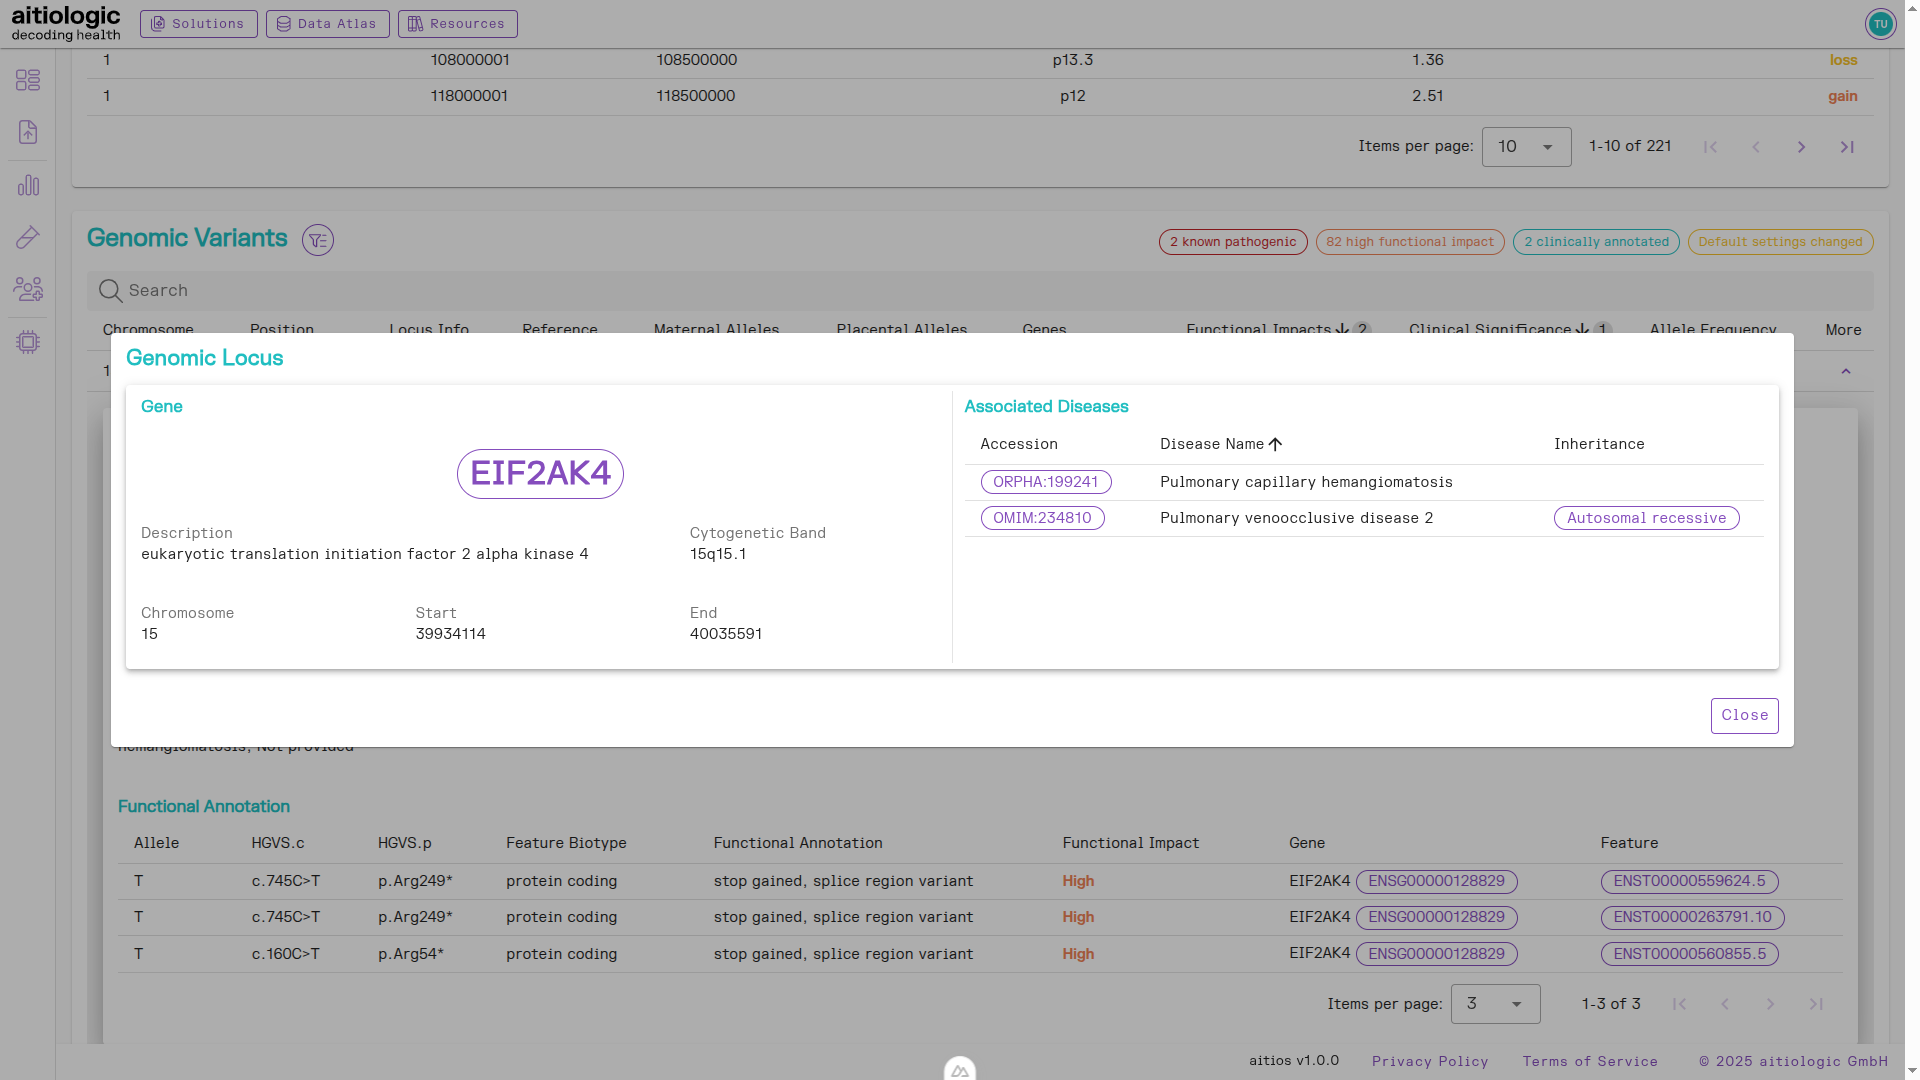
The genetic variants section with additional clinical information displayed for the genomic locus of a found genetic variant.
Quality Control Section
This section contains sequencing data quality control metrics such as read coverage and average read length.
PDF Download
To download a PDF of the NIPT/PE report, click the button marked “PDF” next to the title of the page.